Amimoto Managed Hosting is pleased to announce the implementation of a new dashboard feature: a CPU utilization graph.
This graph displays CPU utilization at a glance and is available for all plans as of June 16, 2023. It is important to note that the items displayed on your graph may vary based on your chosen plan.
Here are some of the benefits of this feature.
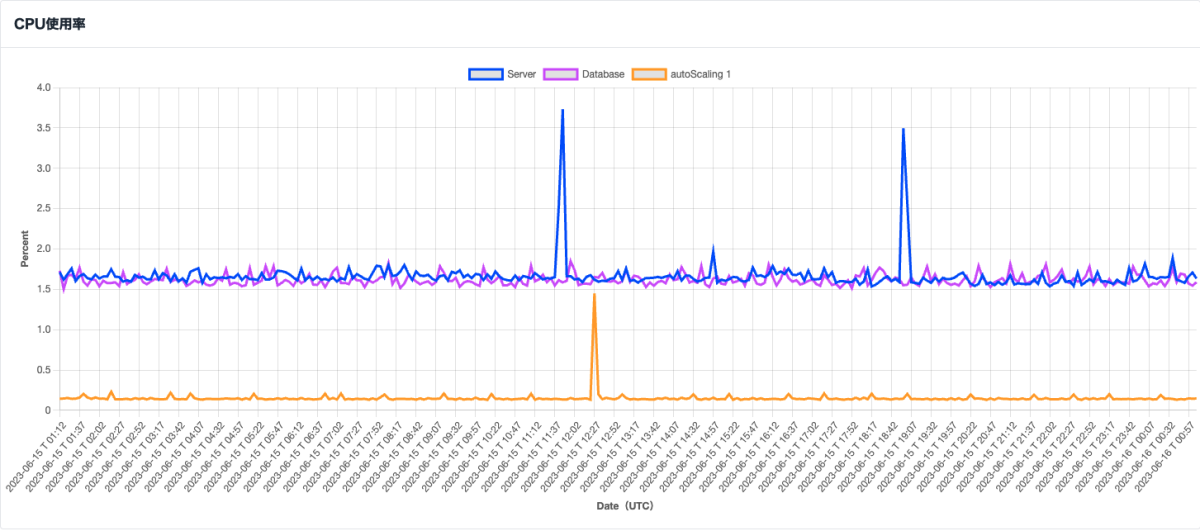
This example graph demonstrates the following information:
- Vertical axis: utilization (%)
- Horizontal axis: Time (UTC / past 24 hours)
Monitoring your CPU utilization can help to indicate your server’s load status. The new graph is a great tool that can help you to better understand your servers performance and gather information to take appropriate action in the event there is a problem.
Consistently high utilization may indicate that your resources are overloaded and a higher tier plan may be necessary to optimize the performance of your application. If this overload occurs at specific times or following specific actions or volumes of application access this new tool can assist in identifying which of these factors are contributing to the issue and help work towards a resolution.
You can view the bandwidth graph on the “Statistics” tab of the Amimoto server administration screen. This graph will show up to three types of CPU usage data graph lines: “Server,” “Database,” and “Auto Scaling,” depending on the level of your plan.
→ Log in to the Amimoto dashboard
For the Personal Plan (Micro/Small), only “Server” data is displayed.
For the Professional Medium Plan, “Database,” and “Auto Scaling” are displayed. Note that this level and above support auto scaling as a standard feature.
For the Professional Large Plan and above, as well as the Business plans, “Server,” “Database,” and “Auto Scaling” data are shown.
For more details about each plan visit the link below.
→ Amimoto Managed Hosting Plans List
We have added a new graph that displays CPU usage in 30-minute increments for a 24-hour period, in addition to the existing bandwidth data. This helps you monitor your server’s daily operation status more effectively. Take advantage of this valuable feature.
If you have any feedback regarding the CPU graph, please don’t hesitate to contact us using the chat button located at the bottom right of the dashboard.
We are committed to continuously improving the system’s usability and greatly appreciate your ongoing support. Thank you for choosing Amimoto Managed Hosting!